11.mnist_matplotlib
In [1]:
import pandas as pd
import numpy as np
import tensorflow as tf
import matplotlib.pyplot as plt

plt.rcParams["axes.unicode_minus"] = False
plt.rcParams["figure.figsize"] = (12, 8)
In [3]:
from tensorflow.examples.tutorials.mnist import input_data
mnist = input_data.read_data_sets("./mnist/data/", one_hot=True)
Extracting ./mnist/data/train-images-idx3-ubyte.gz
Extracting ./mnist/data/train-labels-idx1-ubyte.gz
Extracting ./mnist/data/t10k-images-idx3-ubyte.gz
Extracting ./mnist/data/t10k-labels-idx1-ubyte.gz


variable setting

In [4]:
global_step = tf.Variable(0, trainable=False, name="global_step")
X = tf.placeholder(tf.float32, shape=[None, 784], name="X")
Y = tf.placeholder(tf.float32, shape=[None,  10], name="Y")

W1 = tf.Variable(tf.random_normal([784, 256], mean=0, stddev=0.01), name="W1")
W2 = tf.Variable(tf.random_normal([256, 256], mean=0, stddev=0.01), name="W2")
W3 = tf.Variable(tf.random_normal([256,  10], mean=0, stddev=0.01), name="W3")

b1 = tf.zeros([256], name="bias1")
b2 = tf.zeros([256], name="bias2")
b3 = tf.zeros([10] , name="bais3")


model setting

In [5]:
keep_prob = tf.placeholder(tf.float32)

with tf.name_scope("layer1"):
    L1 = tf.add(tf.matmul(X, W1), b1)
    L1 = tf.nn.relu(L1)
    L1 = tf.nn.dropout(L1, keep_prob)
    
with tf.name_scope("layer2"):
    L2 = tf.add(tf.matmul(L1, W2), b2)
    L2 = tf.nn.relu(L2)
    L2 = tf.nn.dropout(L2, keep_prob)
    
with tf.name_scope("layer3"):
    model = tf.add(tf.matmul(L2, W3), b3)
    
with tf.name_scope("cost"):
    cost = tf.reduce_mean(
        tf.nn.softmax_cross_entropy_with_logits_v2(labels=Y, logits=model))
    opt = tf.train.AdamOptimizer(0.001).minimize(cost, global_step=global_step)
    
    tf.summary.scalar("cost", cost)


model initialization

In [6]:
init = tf.global_variables_initializer()
sess = tf.Session()

sess.run(init)

merged = tf.summary.merge_all()
writer = tf.summary.FileWriter("./logs/mnist_matplotlib", sess.graph)
In [7]:
batch_size = 50
total_batch = int(mnist.train.num_examples / batch_size)
cost_epoch = []


model training

In [8]:
%%time
for epoch in range(20):
    total_cost = 0
    
    for i in range(total_batch):
        batch_xs, batch_ys = mnist.train.next_batch(batch_size)
        
        _, cost_val = sess.run([opt, cost], feed_dict={X:batch_xs, Y: batch_ys, keep_prob:0.8})
        total_cost += cost_val
        cost_epoch.append(total_cost)
        
        summary = sess.run(merged, feed_dict={X:batch_xs, Y: batch_ys, keep_prob:0.8})
        writer.add_summary(summary, global_step=sess.run(global_step))
        
    print("epoch: %d, Avg.cost: %.4f" % (
        epoch+1, total_cost / total_batch
    ))
epoch: 1, Avg.cost: 0.3481
epoch: 2, Avg.cost: 0.1395
epoch: 3, Avg.cost: 0.1000
epoch: 4, Avg.cost: 0.0806
epoch: 5, Avg.cost: 0.0697
epoch: 6, Avg.cost: 0.0591
epoch: 7, Avg.cost: 0.0507
epoch: 8, Avg.cost: 0.0455
epoch: 9, Avg.cost: 0.0417
epoch: 10, Avg.cost: 0.0394
epoch: 11, Avg.cost: 0.0362
epoch: 12, Avg.cost: 0.0361
epoch: 13, Avg.cost: 0.0305
epoch: 14, Avg.cost: 0.0303
epoch: 15, Avg.cost: 0.0271
epoch: 16, Avg.cost: 0.0282
epoch: 17, Avg.cost: 0.0267
epoch: 18, Avg.cost: 0.0267
epoch: 19, Avg.cost: 0.0219
epoch: 20, Avg.cost: 0.0238
CPU times: user 3min 22s, sys: 43.7 s, total: 4min 6s
Wall time: 2min 27s


cost function

In [9]:
plt.figure(figsize=(20, 8))
plt.plot(cost_epoch, "g")
plt.title("cost_epoch")
plt.show()


tensor graph

In [10]:
## jptensor.py 를 워킹디렉토리에 import
import jptensor as jp

tf_graph = tf.get_default_graph().as_graph_def()
jp.show_graph(tf_graph)


test

In [11]:
is_correct = tf.equal(tf.argmax(model, 1), tf.argmax(Y, 1))
accuracy = tf.reduce_mean(tf.cast(is_correct, tf.float32))

accuracy_val = sess.run(accuracy, feed_dict={X: mnist.test.images, 
                                             Y: mnist.test.labels,
                                             keep_prob: 1})

print("accuracy: %.3f" % (accuracy_val))
accuracy: 0.980


labels

In [12]:
labels = sess.run(model, feed_dict={X: mnist.test.images,
                                    Y: mnist.test.labels,
                                    keep_prob: 1})
In [13]:
%matplotlib inline
fig = plt.figure()
for i in range(10):
    # (2, 5)의 그래프, i + 1번째 숫자 이미지 출력
    subplot = fig.add_subplot(2, 5, i+1)
    
    # x, y축 눈금 제거
    subplot.set_xticks([])
    subplot.set_yticks([])
    
    # 출력한 이미지 위에 예측한 숫자를 출력
    # np.argmax와 tf.argmax는 같은 기능
    # 결과값인 labels의 i번째 요소가 one-hot encoding으로 되어 있으므로
    # 해당 배열에서 가장 높은 값을 가진 인덱스를 예측한 숫자로 출력
    subplot.set_title("%d" % (np.argmax(labels[i])))
    
    # 1차원 배열로 되어 있는 i번째 이미지 데이터를
    # 28 x 28형태의 2차원 배열로 변환
    subplot.imshow(mnist.test.images[i].reshape((28, 28)))
plt.show()
In [14]:
from IPython.core.display import HTML, display

display(HTML("<style> .container{width:100% !important;}</style>"))

'Deep_Learning' 카테고리의 다른 글

13.auto-encoder  (0) 2018.12.15
12.mnist_cnn  (0) 2018.12.12
10.mnist_dropout  (0) 2018.12.10
00.write_csv  (0) 2018.12.09
09.mnist_01_minibatch  (0) 2018.12.09
02_linear_regression

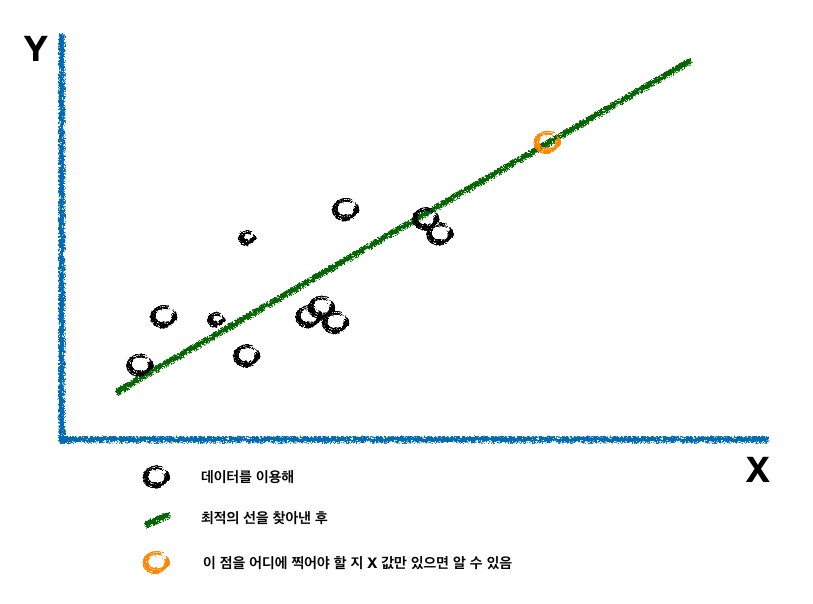
선형 회귀|center

  • 주어진 x와 y 값을 가지고 서로 간의 관계를 파악
  • 새로운 x값이 주어졌을 때 y값을 쉽게 알 수 있음
In [1]:
import tensorflow as tf
In [2]:
x_data = [1, 2, 3]
y_data = [1, 2, 3]


data 생성

In [3]:
W = tf.Variable(tf.random_uniform([1], -1.0, 1.0))
b = tf.Variable(tf.random_uniform([1], -1.0, 1.0))


placeholder 설정

In [4]:
X = tf.placeholder(tf.float32, name="X")
Y = tf.placeholder(tf.float32, name="Y")


model 설정

In [5]:
model = W*X + b


cost function

In [6]:
cost = tf.reduce_mean(tf.square(model- Y))


gradient desent

In [7]:
optimizer = tf.train.GradientDescentOptimizer(learning_rate=0.1)
train_op = optimizer.minimize(cost)

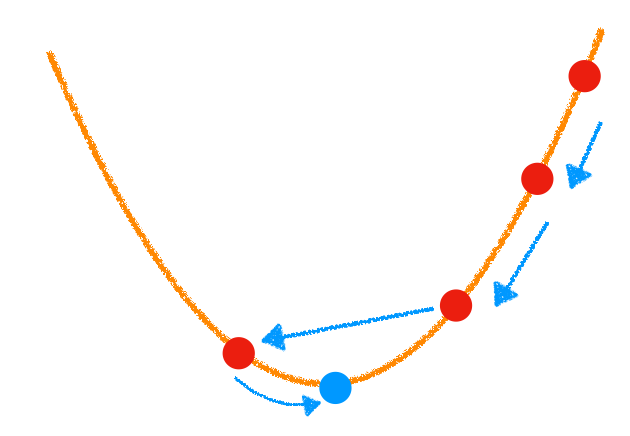
@경사하강법|center


modeling

In [8]:
sess =  tf.Session()
sess.run(tf.global_variables_initializer())
for step in range(500):
    _, cost_val = sess.run([train_op, cost], feed_dict={X: x_data, Y: y_data})
    if step % 25 == 0:
        print("step: {}, cost_val: {:.5f}, W: {}, b: {}".format(step, cost_val, sess.run(W), sess.run(b)))
step: 0, cost_val: 0.45853, W: [0.71138144], b: [0.7272724]
step: 25, cost_val: 0.02285, W: [0.828638], b: [0.389546]
step: 50, cost_val: 0.00677, W: [0.9067342], b: [0.2120151]
step: 75, cost_val: 0.00201, W: [0.9492389], b: [0.11539178]
step: 100, cost_val: 0.00059, W: [0.97237265], b: [0.06280342]
step: 125, cost_val: 0.00018, W: [0.9849635], b: [0.03418154]
step: 150, cost_val: 0.00005, W: [0.99181616], b: [0.01860373]
step: 175, cost_val: 0.00002, W: [0.99554586], b: [0.01012532]
step: 200, cost_val: 0.00000, W: [0.9975758], b: [0.00551084]
step: 225, cost_val: 0.00000, W: [0.9986806], b: [0.00299932]
step: 250, cost_val: 0.00000, W: [0.99928194], b: [0.00163241]
step: 275, cost_val: 0.00000, W: [0.9996092], b: [0.00088852]
step: 300, cost_val: 0.00000, W: [0.9997873], b: [0.00048356]
step: 325, cost_val: 0.00000, W: [0.9998842], b: [0.00026316]
step: 350, cost_val: 0.00000, W: [0.99993694], b: [0.00014328]
step: 375, cost_val: 0.00000, W: [0.9999657], b: [7.794145e-05]
step: 400, cost_val: 0.00000, W: [0.99998134], b: [4.2393247e-05]
step: 425, cost_val: 0.00000, W: [0.9999898], b: [2.3081342e-05]
step: 450, cost_val: 0.00000, W: [0.99999446], b: [1.2575029e-05]
step: 475, cost_val: 0.00000, W: [0.99999696], b: [6.8529835e-06]


test

In [9]:
class prediction:
            
    def run(self, input):  
        self.input = input
        output = sess.run(model, feed_dict={X: self.input})
        print("X: {}, Y-result: {}".format(self.input, output))
        
pred = prediction()
In [10]:
pred.run(2.5)
pred.run(5)
pred.run(10)
X: 2.5, Y-result: [2.4999995]
X: 5, Y-result: [4.999995]
X: 10, Y-result: [9.999987]
In [11]:
from IPython.core.display import HTML, display

display(HTML("<style> .container{width:100% !important;}</style>"))

'Deep_Learning' 카테고리의 다른 글

06.tensorboard01_example  (0) 2018.12.09
05.deep_neural_net_Costfun2  (0) 2018.12.09
04.deep_neural_net_Costfun1  (0) 2018.12.09
03.classification  (0) 2018.12.09
01.tesnsor_and_graph  (0) 2018.12.09

#!/usr/bin/env python3


TensorFlow Way of LinearRegression


이번 예제에서는 tensorflow를 통해 일괄적으로 데이터에 대한 루프를 돌면서 기울기와 y절편을  갱신할 것입니다.

Petal width꽃잎 폭을 x로 Sepal length길이를 y로하는 데이터를 대상으로 최적 직선을 찾아보겠습니다. L2 비용 함수를 사용하겠습니다.


iris데이터셋으로 Linear Regression을 해결하기 위해서는 역시 아래 방정식을 풀어야 합니다.

$$y = Ax+b$$


linear regression computational graph를 사용하기 위해서서는 input으로 $x$ 를 넣었을 때, 

$Ax+b$가 만들어져야 하고 $A$, $b$는 손실값이 최소가 되어야 합니다.

import numpy as np

import tensorflow as tf

from sklearn.datasets import load_iris

from tensorflow.python.framework import ops


iris = load_iris()


print(iris.keys())

# dict_keys(['data', 'target', 'target_names', 'DESCR', 'feature_names'])


print(iris.feature_names)

# ['sepal length (cm)', 'sepal width (cm)', 'petal length (cm)', 'petal width (cm)']


x_vals = np.array([x[3] for x in iris.data])

y_vals = iris.data[:,0]


batch_size = 25


x_data = tf.placeholder(shape=[None, 1], dtype=tf.float32)

y_target = tf.placeholder(shape=[None, 1], dtype=tf.float32)


A = tf.Variable(tf.random_normal(shape=[1, 1]))

b = tf.Variable(tf.random_normal(shape=[1, 1]))


데이터가 준비되었으니 tensorflow 방식으로 algorithm을 구현하면 다음과 같습니다.

with tf.Session() as sess:

    model_output = tf.add(tf.matmul(x_data, A), b) # linear regression fomula

    loss = tf.reduce_mean(tf.square(y_target - model_output)) # L2 loss

    my_opt = tf.train.GradientDescentOptimizer(learning_rate=0.05) 

    train_step = my_opt.minimize(loss) # loss가 최소인 방향으로 다음 단계 이동


    init = tf.global_variables_initializer()

    init.run()


    loss_vec = []

    for i in range(100):

        rand_idx = np.random.choice(len(x_vals), size=batch_size) 

        rand_x = x_vals[rand_idx].reshape(-1, 1)

        rand_y = y_vals[rand_idx].reshape(-1, 1)


        fedict={x_data: rand_x, y_target:rand_y}


        sess.run(train_step, feed_dict=fedict) # step 반복

        temp_loss = sess.run(loss, feed_dict=fedict)

        loss_vec.append(temp_loss)


        if (i+1)%20==0:

            print('Step {}\nA={}, b={}   Loss={:.5f}'.format(i+1, A.eval(), b.eval(), temp_loss))

            # Step 20

            # A=[[2.4062862]], b=[[2.4534268]]   Loss=1.78677

            # Step 40

            # A=[[1.9556967]], b=[[3.2615643]]   Loss=0.92836

            # Step 60

            # A=[[1.5368886]], b=[[3.698664]]   Loss=0.53148

            # Step 80

            # A=[[1.4006948]], b=[[4.085002]]   Loss=0.46051

            # Step 100

            # A=[[1.1938996]], b=[[4.331669]]   Loss=0.31104


    [slope] = A.eval()

    print('slope: {}'.format(slope))

    # slope: [1.1938996]


    [cept] = b.eval()

    print('intercept: {}'.format(cept))

    # intercept: [4.331669]


위의 결과를 시각화하는 코드는 다음과 같습니다.

import matplotlib.pyplot as plt


best_params = []

for i in x_vals.ravel():

    poly = i*slope+cept

    best_params.append(poly)


plt.scatter(x_vals, y_vals, label='Data Points', edgecolors='k')

plt.plot(x_vals, best_params, 'red')

plt.xlabel('Petal Width', size=15)

plt.ylabel('Sepal Length', size=15)

plt.title('Petal Width vs Sepal Length')

plt.show()


plt.plot(loss_vec, c='k')

plt.xlabel('Generation')

plt.ylabel('L2 Loss')

plt.title('L2 Loss per Generation')

plt.show()


참고 자료: 

[1]TensorFlow Machine Learning Cookbook, Nick McClure

[2]https://github.com/nfmcclure/tensorflow_cookbook

#!/usr/bin/env python3


Getting Start Tensorflow


tensorflow는 객체로 만들어지기 때문에 출력을 위해 printf를 정의하고 이 것을 사용하겠습니다.

import tensorflow as tf


def printf(tfclass):

    init = tf.global_variables_initializer()

    with tf.Session() as sess:

        sess.run(init)

        rlt = tfclass.eval()

    print(rlt)


0 값으로 채워진 텐서는 다음과 같이 생성합니다.

zero_tsr = tf.zeros([3, 2])

printf(zero_tsr)

# [[0. 0.]

#  [0. 0.]

#  [0. 0.]]


1 값으로 채워진 텐서는 다음과 같이 생성합니다.

ones_tsr = tf.ones([3, 2])

printf(ones_tsr)

# [[1. 1.]

#  [1. 1.]

#  [1. 1.]]


동일한 상수값으로 채워진 텐서는 다음과 같이 생성합니다.

filled_tsr = tf.fill([3, 2], 9)

printf(filled_tsr)

# [[9 9]

#  [9 9]

#  [9 9]]


기존 상수를 이용해 텐서를 생성할 때는 다음 방식을 사용합니다.

constant_tsr = tf.constant([1, 2, 3])

printf(constant_tsr)

# [1 2 3]


기존 텐서의 형태를 바탕으로 텐서 변수를 초기화하는 것도 가능합니다.

zeros_similar = tf.zeros_like(constant_tsr)

printf(zeros_similar)

# [0 0 0]

ones_similar = tf.ones_like(constant_tsr)

printf(ones_similar)

# [1 1 1]


텐서플로는 구간을 지정하는 방식으로 텐서를 선언할 수 있습니다. 다음 함수는 range()나 numpy의 linspace()와 비슷하게 동작합니다.

linear_tsr = tf.linspace(0.0, 1.0, num=3)

printf(linear_tsr)

# [0.  0.5 1. ]


integer_seq_tsr = tf.range(6.0, 15, delta=3)

printf(integer_seq_tsr)

# [ 6.  9. 12.]


랜덤한 숫자도 뽑아낼 수 있습니다.

randunif_tsr = tf.random_uniform([3, 2], minval=0, maxval=1, dtype=tf.float32)

printf(randunif_tsr)

# [[0.218009   0.7311672 ]

#  [0.6954018  0.2027992 ]

#  [0.95226717 0.9950316 ]]


randnorm_tsr = tf.random_normal([3, 2], mean=0.0, stddev=1.0)

printf(randnorm_tsr)

# [[-0.45060402 -1.6076114 ]

#  [ 0.7157349  -0.28653365]

#  [ 1.2830635   0.6957943 ]]


특정 범위에 속하는 정규 분포 임의의 값을 생성하고 싶은 경우에 지정한 평균에서 항상 표준편차 2배 이내의 값을 뽑아줍니다.

truncnorm_tsr = tf.truncated_normal([3, 2], mean=3.0, stddev=1.0)

printf(truncnorm_tsr)

# [[2.6660793 2.3485358]

#  [3.378799  2.757817 ]

#  [2.8825157 1.9243042]]


배열의 항목을 임의로 섞을 때

shuffle_output = tf.random_shuffle(truncnorm_tsr)

printf(shuffle_output)

# [[2.174755  4.001117 ]

#  [2.6528723 2.8258555]

#  [3.5614102 2.8608997]]


cropped_output = tf.random_crop(shuffle_output, [3, 2])

printf(cropped_output)

# [[2.6678126 2.087521 ]

#  [1.5311174 4.574707 ]

#  [2.400455  3.175764 ]]


참고 자료: 

[1]TensorFlow Machine Learning Cookbook, Nick McClure

'Tensorflow > Introduction' 카테고리의 다른 글

Activation Function  (0) 2018.04.25
placeholder, marix, operation  (0) 2018.04.25

+ Recent posts